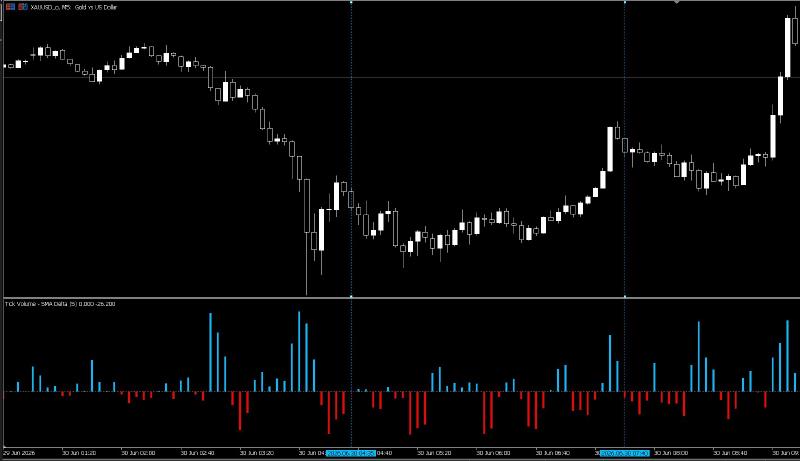
Indicator for Measuring Tick Volume Delta
Download Tick Volume Delta Indicator (github) #
Tick Volume SMA Delta is a lightweight technical indicator for MetaTrader 5 that measures the difference between the current candle’s tick volume and the simple moving average of recent tick volumes. The result is displayed as a color-coded histogram, making it easy to identify periods when market activity is unusually high or low compared to its recent behavior.
The primary purpose of this indicator is to highlight significant changes in tick volume. A noticeable decrease in tick volume may indicate weakening market participation and a loss of momentum, making this indicator a useful confirmation tool for trading strategies that focus on potential price reversals.
This indicator is not intended to generate standalone buy or sell signals. Instead, it is designed to complement other forms of technical analysis.
What Is Tick Volume? #
In many financial markets, especially the Forex market, traders do not have access to the actual traded volume. Instead, MetaTrader provides tick volume, which represents the number of price changes that occur during the formation of each candle.
A higher tick volume generally indicates greater market activity, while a lower value suggests reduced participation. Although tick volume is not the same as real trading volume, it has been widely used by traders as a practical measure of market activity.
How the Indicator Works #
For every completed candle, the indicator performs the following steps:
- Calculates the simple moving average of tick volume over a user-defined period.
- Compares the current candle’s tick volume with this average.
- Displays the difference as a histogram.
When the current tick volume is above its recent average, the histogram is plotted above zero. When it falls below the average, the histogram is plotted below zero.
This simple comparison allows traders to quickly identify whether market activity is increasing or decreasing relative to recent conditions.
Histogram Interpretation #
The histogram uses two colors for easy visualization.
- Blue bars indicate that the current tick volume is higher than its recent average.
- Red bars indicate that the current tick volume is lower than its recent average.
A horizontal zero line separates positive and negative values, making changes in market activity easy to recognize at a glance.
Practical Applications #
The indicator can be used in several ways, including:
- Detecting declines in market activity
- Identifying unusually low tick volume
- Evaluating the strength of ongoing price movements
- Confirming potential price reversal areas
- Acting as an additional filter within trading strategies
One of its most common applications is identifying situations where price continues to move while tick volume begins to decline. This may suggest that fewer market participants are supporting the current move, which, depending on the overall market context, can be an early sign of weakening momentum or a possible reversal.
However, this observation should always be confirmed with additional technical evidence before making trading decisions.
How to Use the Indicator #
The indicator performs best when combined with other analytical tools, such as:
- Price action analysis
- Support and resistance levels
- Supply and demand zones
- Candlestick patterns
- Divergence analysis
- Market structure
- Risk management
For example, if price reaches a significant resistance area while tick volume simultaneously drops below its recent average, the combination may provide additional confirmation that buying pressure is weakening. Even in such cases, trading decisions should never rely solely on this indicator.
Indicator Settings #
The indicator includes a single configurable parameter.
Period #
This setting defines the number of candles used to calculate the simple moving average of tick volume.
Smaller values make the indicator more responsive to short-term changes, while larger values produce smoother results by filtering out minor fluctuations.
The default value is 5.
Advantages #
- Lightweight and efficient
- Suitable for all timeframes
- Compatible with most financial markets
- Easy to interpret
- Useful as a confirmation tool for reversal strategies
- Clean and straightforward visual presentation
Limitations #
Before using this indicator, it is important to understand its limitations.
- It is based on tick volume rather than real trading volume.
- It is not designed to generate standalone trading signals.
- A decrease in tick volume does not necessarily indicate a price reversal.
- Its signals should always be evaluated alongside other technical analysis tools.
Conclusion #
Tick Volume SMA Delta is a simple yet practical indicator for measuring how current tick volume deviates from its recent average. By highlighting changes in market activity, it helps traders evaluate whether price movements are gaining or losing participation.
For traders who incorporate reversal analysis into their trading strategies, this indicator can serve as a valuable confirmation tool when used alongside price action, support and resistance levels, market structure, and sound risk management. Like any technical indicator, it should be considered one component of a broader trading approach rather than a standalone decision-making tool.